You are here: Running the Model > Run-Time Menus & Controls > Debug Option > Debugger Dialog Box
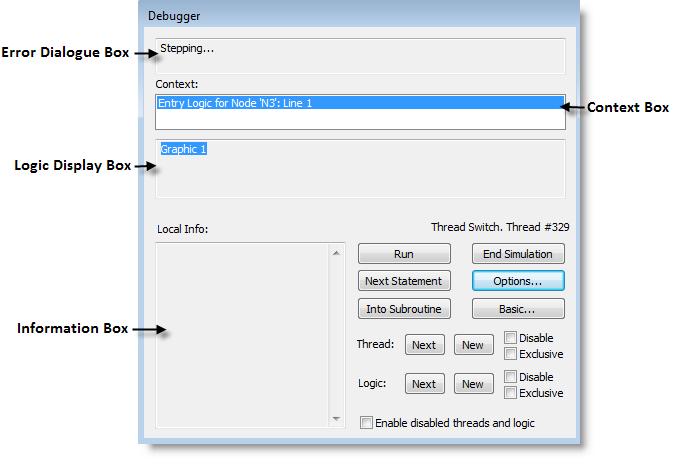
The Debugger can be used in two modes: Basic and Advanced. The Basic Debugger appears initially with the option of using the Advanced Debugger. The Basic Debugger dialog box is shown below:
Error Display Box Displays the error message or reason why the Debugger dialog box is displayed, such as the User-Condition becoming true.
Logic Display Box Displays the statements of the current logic being executed.
Context Box Displays the module, operation, and line number (in which the debugger stopped) in the Information box.
Information Box Displays local variables and entity attributes with non-zero values in the Information box.
End Simulation Choose this option to terminate the simulation. This will prompt you about collecting statistics.
Run Continues to run the simulation, but still checks the debugger options selected in the Debugger Options dialog box.
Next Statement Jumps to the next statement in the current thread. If the last statement executed suspends the thread (e.g., the entity is waiting to capture a resource), another thread meeting the debugger conditions may be displayed as the next statement.
Next Thread Brings up the Debugger at the next initiated or resumed thread.
Into Subroutine Steps to the first statement in the next subroutine executed by this thread. Again, if the last statement executed suspends the thread, another thread meeting debugger conditions may be displayed first. If no subroutine is found in the current thread, a message is displayed in the Error Display box.
Options Brings up the Debugger Options dialog box. You may also bring up this dialog box from the Simulation menu.
Advanced Changes the Debugger to Advanced mode, provides additional options discussed next.